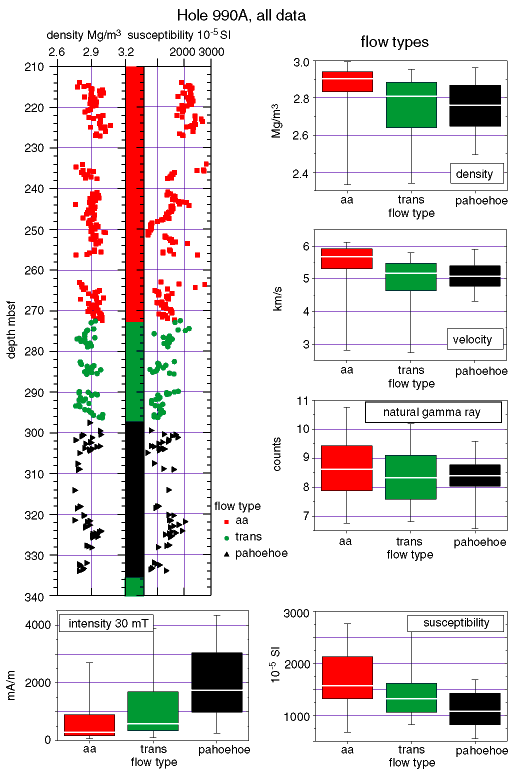
Figure 3. Box and whisker plots of the overall physical and magnetic properties of each flow type together with the downhole variation of density and magnetic susceptibility. The white lines inside the boxes represent the average values. The upper and lower boundaries of the boxes show the 25 and the 75 percentile, respectively. Thus, 50% of the data are inside the box. The whiskers (small horizontal lines at the ends of the vertical lines) are marking the 5 and the 95 percentile, respectively.

![]()