![]()
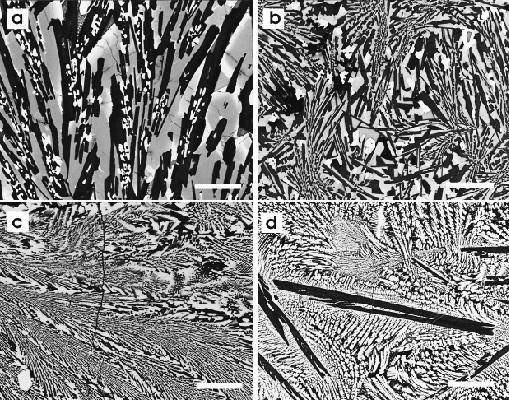
Figure 11. Backscattered electron images illustrating the change in dendrite width (spacing) with increasing cooling rate. All images are from experiments quenched to 1000° C, scale bars = 20 µm. (A) 10° C/hr; (B) 50° C/hr; (C) 100° C/hr; and (D) 1000° C/hr.
![]()