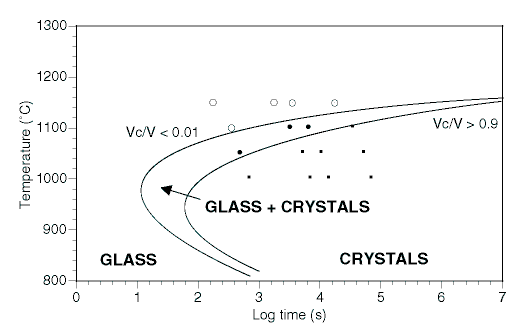
Figure 15. Temperature-time-transformation diagram for the experiments conducted. Bounding lines shown the approximate fields for glass (Vc/V<0.01), glass + crystals (0.01<Vc/V<0.9) and complete solidification (Vc/V>0.9). The nose of the curves was approximated using the relationship of Uhlmann et al. (1979, 1981).
