![]()
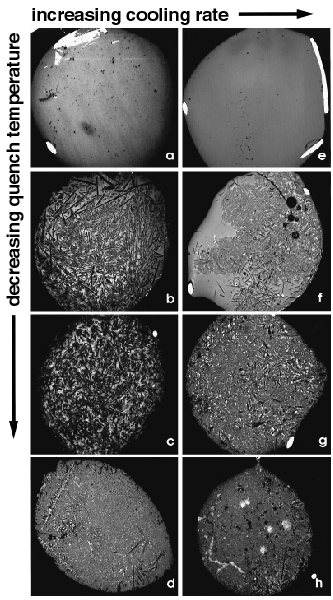
Figure 7. Backscattered electron images of experimental charges. The field of view of each image is 3 mm (in width). In these and all following images, the darkest phase is plagioclase, medium gray is pyroxene, light gray is glass, and white is either oxides or platinum wire. Vertical rows show the change in texture with decreasing quench temperature at a constant cooling rate. Horizontal rows show the change in texture at the same quench temperature for increasing rates of cooling. Experiment numbers are those used in Table 1. (A) #37; 10° C/hr to 1150° C; (B) #31; 10° C/hr to 1100° C; (C) #12; 10° C/hr to 1050° C; (D) #17; 10° C/hr to 1000° C; (E) #32; 50° C/hr to 1150° C; (F) #23; 50° C/hr to 1100° C; (G) #41; 50° C/hr to 1050° C; (H) #11; 50° C/hr to 1000° C; (continued on next page).
![]()