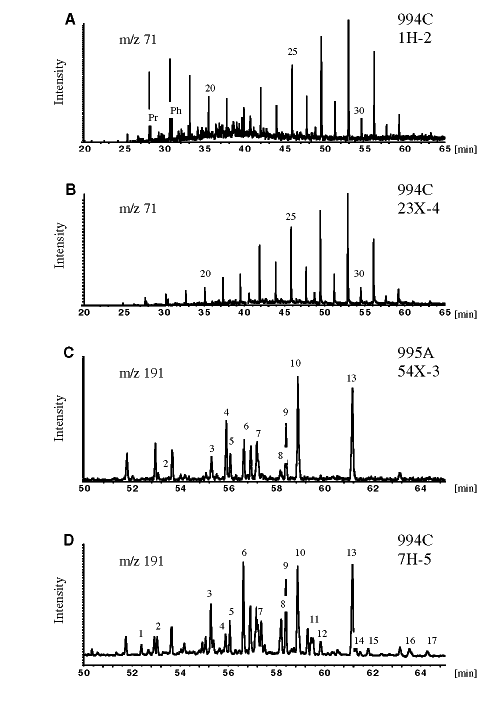
Figure 2. Mass fragmentograms m/z 71 (A, B) and m/z 191 (C, D) of samples from Holes 994C and 995A. (A) shows algal and higher plant wax contribution, whereas (B) is typical for pure plant wax input. Carbon numbers of the n-alkanes and the position of pristane (Pr) and phytane (Ph) are given. (C) shows triterpenoid distributions that are typical for immature organic matter, and the triterpenoid pattern of (D) additionally contains mature compounds (compounds 11-17, except 13). Min = minutes, gas chromatography retention time. For peak identification, see Table 2.

![]()