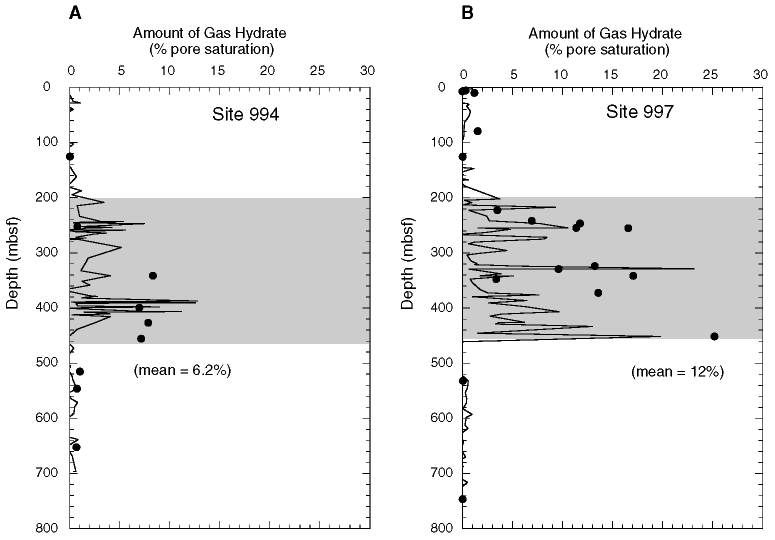
Figure 7. Amount of gas hydrate (dots) at Sites 994 (left) and 997
(right), estimated from oxygen isotopic fractionation (![]() )
and
)
and ![]() 18O
anomaly of the interstitial waters. Gas hydrate estimates from chloride anomaly
are also given by thin lines. Gas hydrate zones are shown by shaded area.
18O
anomaly of the interstitial waters. Gas hydrate estimates from chloride anomaly
are also given by thin lines. Gas hydrate zones are shown by shaded area.

![]()