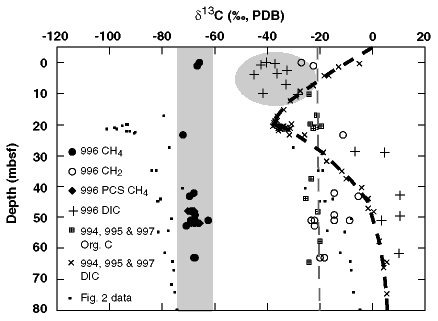
Figure 3. Profiles of carbon isotopic values of methane and carbon dioxide in the free gases, PCS-collected methane, and dissolved inorganic carbon (DIC) in Site 996 vs. sub-bottom depth. Symbols are indicated in key. Data are in
Table 1, Table
2, Table 5, and Table
6. Gas sample values from Sites 991, 993, 994, 995, and 997 (small squares), sedimentary organic carbon from Sites 994, 995, and 997 (cross filling square); and DIC from Sites 994, 995, and 997 (smaller squares) are also plotted in
Figure 2 for comparison. The range of values for Site 996 is indicated by the shaded pattern showing enrichment in  13C compared with values from a similar depth at other sites on the Blake Ridge. Similarly, the shallowest (<10 mbsf) DIC
  13C values (within gray-shaded oval), are unusually 13C depleted for their depth compared with the data from Sites 994, 995, and 997 (indicated by dashed line).

![]()