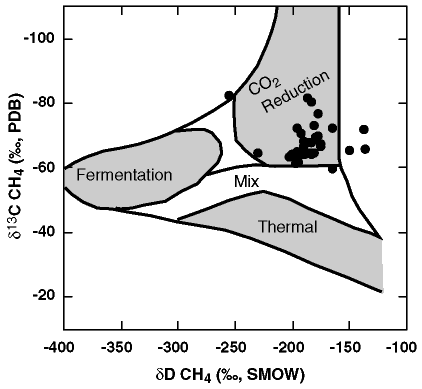
Figure 5. Crossplot of the  D vs.
D vs.  13C values of CH4 samples collected on Leg 164. Superimposed on the figure are the boundaries for the known ranges for CH4 produced via microbial fermentation, microbial CO2 reduction, and thermogenic processes after Whiticar et al. (1986).

![]()