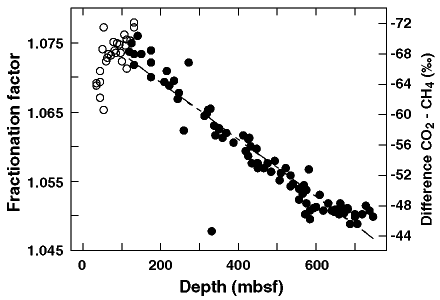
Figure 6. Plot showing both variation in the difference between coexisting CO2 and CH4  13C values and the fractionation factor computed from their isotopic values vs. depth of the samples from Sites 994, 995, and 997. Closed circles are used below 120 mbsf and open circles above 120
mbsf.

![]()