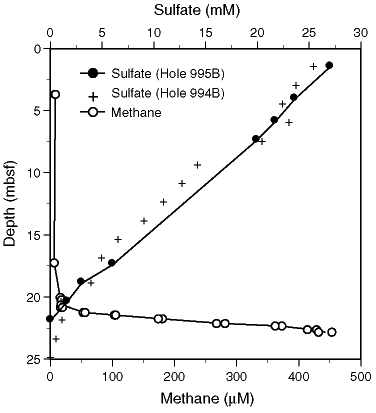
Figure 1. Pore-water concentrations of methane and sulfate vs. depth in Hole 995B. Sulfate concentrations from Hole 994B are also plotted to show that the two sites are comparable with respect to the depth of sulfate depletion. Note the upward concavity of the methane concentration profile (indicating methane consumption) near the base of the sulfate-containing zone. Sulfate concentration data are from Paull, Matsumoto, Wallace, et al. (1996).

![]()