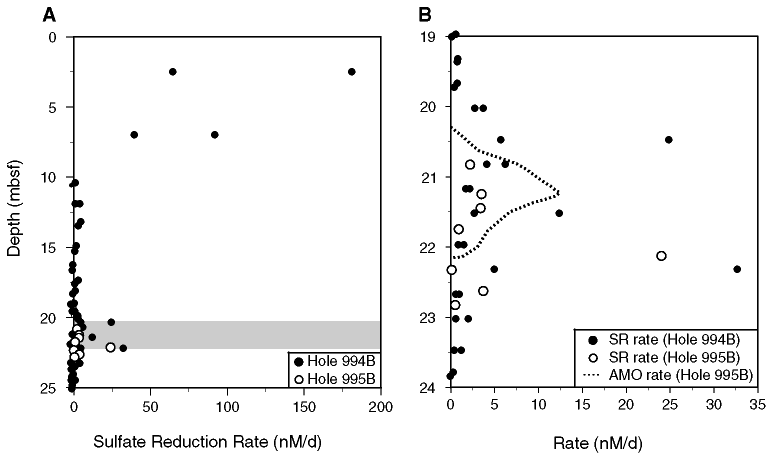
Figure 4. The relationship of sulfate reduction and methane oxidation. A. 35S-tracer-based rates of sulfate reduction in sediments from Holes 994B and 995B. Note the subsurface maximum in rates that coincides with the model-predicted methane oxidation zone (shaded region). B. Blow-up of the 19-24 mbsf depth interval showing the relative localization and magnitude of measured sulfate reduction rates in Holes 994B and 995B to model-derived methane oxidation rates in Hole 995B. AMO = anaerobic methane oxidation.

![]()