![]()
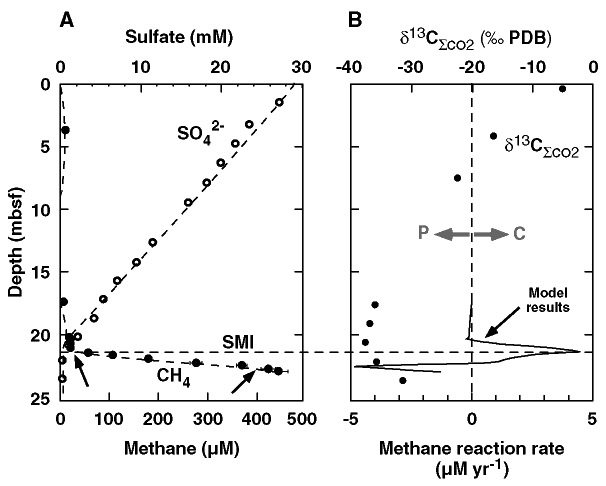
Figure 5.
Graphs showing model results for Site 995 data. A. Sulfate
concentrations (Paull, Matsumoto, Wallace, et al., 1996) and methane
concentrations (Hoehler et al., Chap.
8, this volume) measured at Site 995. A cubic spline function was used
to fit the methane concentration profile. Inflections in the methane
concentration trend are highlighted with arrows. The dashed line associated with
sulfate concentrations is not a linear regression fit to the data like that in Figure
2B, but was calculated by the numerical model by increasing methane
oxidation rates seen in Figure 2B
by approximately three times. B. Zones for methane production
(P) and consumption (C) predicted by the model, and calculated methane reaction
rates (R) are in units of mM yr-1 (or mmol cm-3 yr-1).
![]() 13C
values of the dissolved CO2 (
13C
values of the dissolved CO2 (![]() CO2)
pool are plotted for comparison.
CO2)
pool are plotted for comparison.
![]()