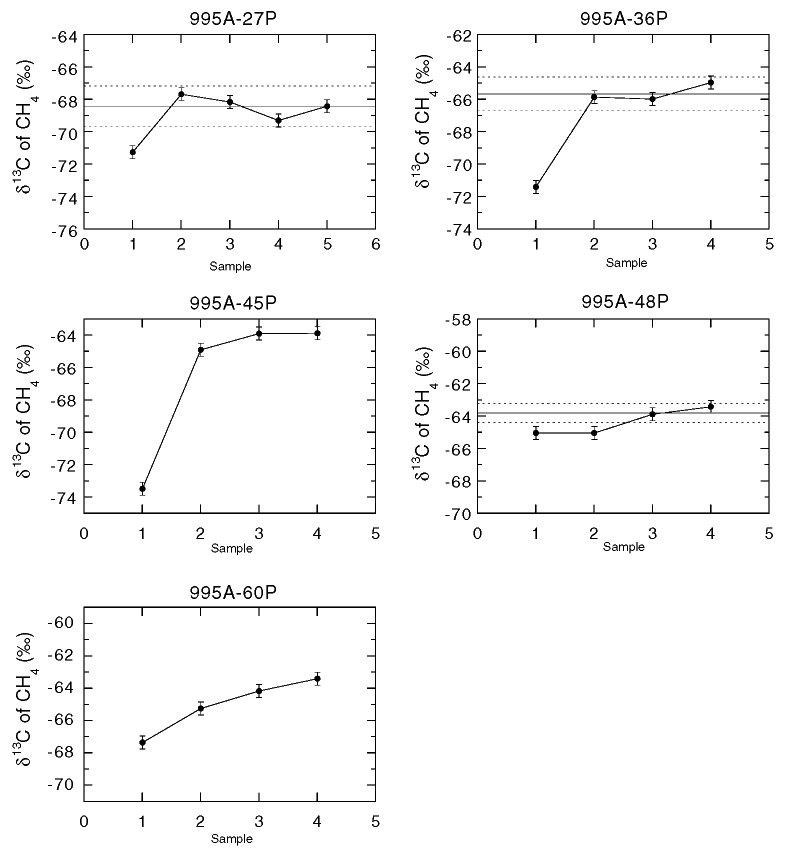
Figure 2.
Times series plots of methane ![]() 13C
values from PCS cores at Site 995. Each panel shows data from a single PCS core.
Gases were evolved sequentially from the PCS, with the first gas sample released
and collected labelled as Sample 1 (see text and Paull, Matsumoto, Wallace, et
al., 1996, for details). The scale of the vertical axes is the same in all
panels. Error bars show analytical uncertainties of 2 standard deviations (±0.4
13C
values from PCS cores at Site 995. Each panel shows data from a single PCS core.
Gases were evolved sequentially from the PCS, with the first gas sample released
and collected labelled as Sample 1 (see text and Paull, Matsumoto, Wallace, et
al., 1996, for details). The scale of the vertical axes is the same in all
panels. Error bars show analytical uncertainties of 2 standard deviations (±0.4![]() ).
For each core, the average
).
For each core, the average ![]() 13C
value calculated by weighting the individual measurements by the volume of CH4
released is shown by a horizontal line (±2
13C
value calculated by weighting the individual measurements by the volume of CH4
released is shown by a horizontal line (±2![]() uncertainty shown as dashed line). Average
uncertainty shown as dashed line). Average ![]() 13C
values could not be calculated for Cores 164-995A-45P and 60P because the volume
was not measured for all gas aliquots.
13C
values could not be calculated for Cores 164-995A-45P and 60P because the volume
was not measured for all gas aliquots.

![]()