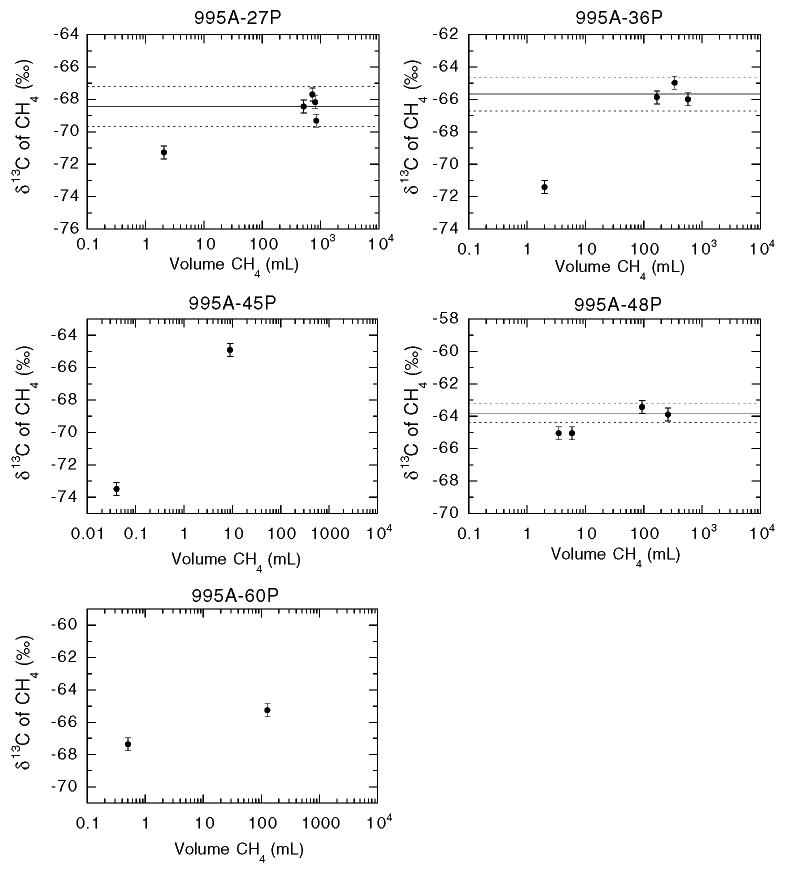
Figure 5.
Methane ![]() 13C
values plotted against volume of CH4 (in mL) released during stepwise degassing
of PCS cores at Site 995. Data for gas volumes are in Table 1. The scale of the
vertical axes is the same in all panels. Error bars show analytical
uncertainties of 2 standard deviations (±0.4
13C
values plotted against volume of CH4 (in mL) released during stepwise degassing
of PCS cores at Site 995. Data for gas volumes are in Table 1. The scale of the
vertical axes is the same in all panels. Error bars show analytical
uncertainties of 2 standard deviations (±0.4![]() ).
For each core, the average
).
For each core, the average ![]() 13C
value calculated by weighting the individual measurements by the volume of CH4
released is shown by a horizontal line (±2s uncertainty shown as dashed line).
13C
value calculated by weighting the individual measurements by the volume of CH4
released is shown by a horizontal line (±2s uncertainty shown as dashed line).

![]()