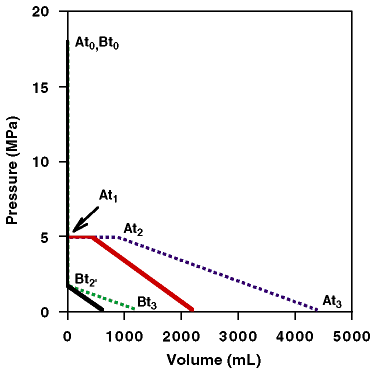
Figure 3. Expected volume-pressure curves for cores with (Path A) CH4 hydrate and dissolved CH4 in seawater, and (Path B) only dissolved CH4 in seawater as pressure is released through incremental gas volume loss over time at isothermal conditions (here 5ºC). Initial conditions for Path A cores are CH4 molality of 0.09 mol/kg and pressure of 18 MPa; initial conditions for Path B cores are CH4 molality of 0.025 mol/kg and pressure of 18 MPa. Solid lines represent cores with a water volume of 1 L, whereas stippled lines represent cores with a water volume of 2 L. Note that this figure has been significantly modified from original figure by Hunt (1979, p. 161).

![]()