![]()
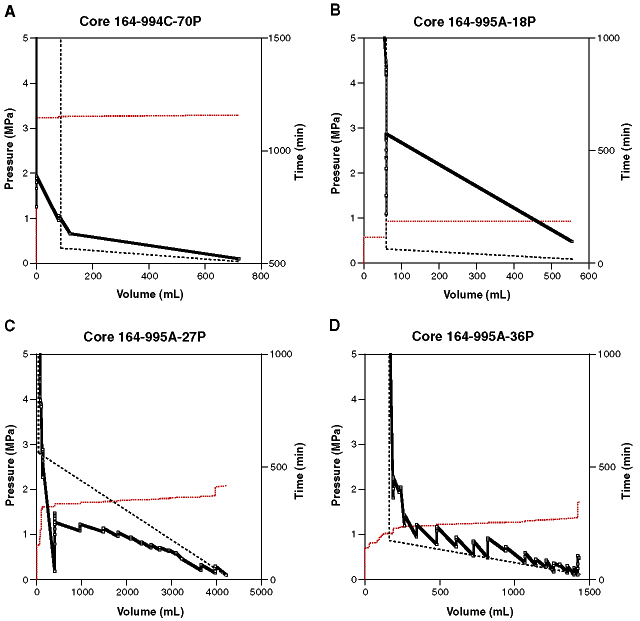
Figure 4. Observed (solid curve) and synthetic (dashed curve) volume-pressure plots for Cores (A) 164-994C-70P, (B) 164-995A-18P, (C) 164-995A-27P, (D) 164-995A-36P, (E) 164-995A-45P, (F) 164-995A-48P, (G) 164-995A-52P, (H) 164-995A-60P, (I) 164-995B-7P, (J) 164-995B-10P, (K) 164-996A-7P, (L) 164-996D-7P, (M) 164-997A-18P, (N) 164-997A-25P, (O) 164-997A-33P, (P) 164-997A-49P, (Q) 164-997A-55P, (R) 164-997B-10P, (S) 164-997B-15P, and (T) 164-997B-21P. Also shown are volume-time plots (stippled curve) for each core. Total volumes of gas released for each core are listed in Table 2. A. Core 164-994C-70P released 720 mL of gas (~600 mL of CH4) at 0ºC over 19 min. Gas was released very quickly, and the core was not removed from the ice bath after reaching atmospheric pressure. B. Core 164-995A-18P released 555 mL of gas (~495 mL of CH4) at 0ºC over 76 min. The port connection to this core became clogged with sediment prior to release of all gas at atmospheric pressure. Pressures on the synthetic volume-pressure plot for B are too low for a given volume. C. Core 164-995A-27P released 3975 mL of gas (~3870 mL of CH4) at 0ºC over 225 min, and 4215 mL of gas (~4110 mL of CH4) at less than ~15ºC over 264 min. D. Core 164-995A-36P released 1420 mL of gas (~1290 mL of CH4) at 0ºC over 141 min, and 1430 mL of gas (~1300 mL of CH4) at less than ~15ºC over 206 min. The port connection to this core became clogged with sediment during warming of the core (although after atmospheric pressure was reached initially). Pressures on the synthetic volume-pressure plot for D are too low for a given volume.

![]()