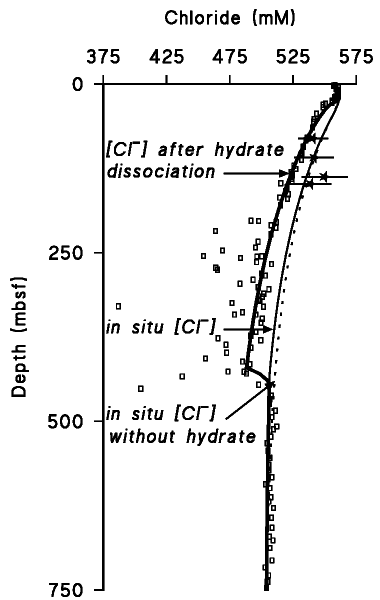
Figure 4. A. Measured chloride concentrations at Site 997 including in situ pore-water samples (stars, error bars = ±1 STD). The light solid line is the expected pore-water Cl- profile at in situ pressure and temperature conditions using the advection/diffusion model of Egeberg and Dickens (1999). The boldface line is the expected pore-water profile after gas hydrate dissociation and release of fresh water during core recovery (best fit through the data). Also shown is an expected in situ pore-water Cl- profile (dotted line) without gas hydrate in pore space. B. Close up for upper 200 m of profile.

![]()