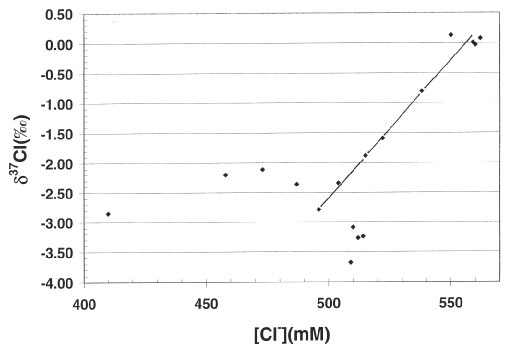
Figure 7. Plot of 37Cl vs. (Cl-) for Site 997. Data points with 37Cl < -3.00 are from zone 4 of the chloride profile (Fig. 1, Fig. 2, Fig. 3), where the chlorinity is more or less constant. For further explanations see text.