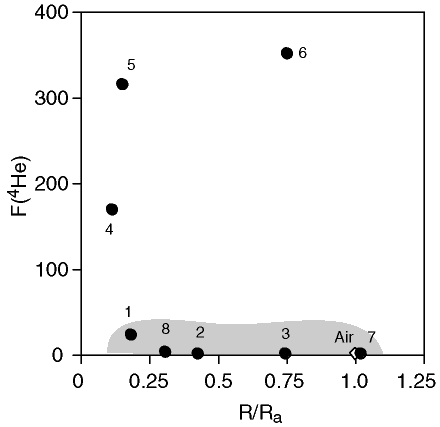
Figure 5. Correlation plot of the relative abundance of He (F[4He]) and He isotopes (R/Ra) of Blake Ridge gas hydrate specimens and air. Samples numbers are those listed in Table 2 and Table 3. Samples with a component of hypothesized Gas B are shaded.

![]()