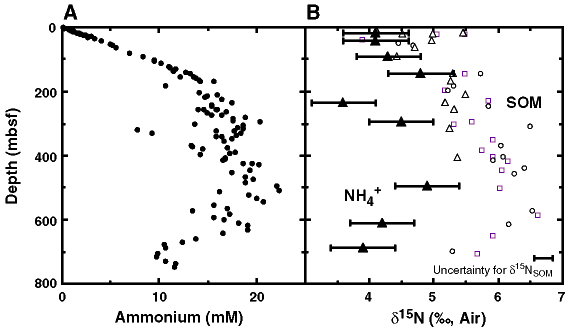
Figure 1.
A. Plot of interstitial ammonium concentration values vs. depth from
Paull, Matsumoto, Wallace, et al. (1996). Note linear profile above 200 mbsf. B.
Interstitial ammonium ![]() 15N
values in per mil units relative to the nitrogen Air standard (solid triangles)
and nitrogen isotopic values of sedimentary organic matter (SOM) at Sites 994
(open circles), 995 (open squares), and 997 (open triangles) from Olsen (1997)
and Paull et al. (Chap. 7,
this volume). Measurement uncertainty in
15N
values in per mil units relative to the nitrogen Air standard (solid triangles)
and nitrogen isotopic values of sedimentary organic matter (SOM) at Sites 994
(open circles), 995 (open squares), and 997 (open triangles) from Olsen (1997)
and Paull et al. (Chap. 7,
this volume). Measurement uncertainty in ![]() 15NNH4+
is shown by error bars; the error bar in the lower right corner refers to the
general measurement uncertainty in
15NNH4+
is shown by error bars; the error bar in the lower right corner refers to the
general measurement uncertainty in ![]() 15NSOM
(H. Mendlovitz, pers. comm., 1998).
15NSOM
(H. Mendlovitz, pers. comm., 1998).
