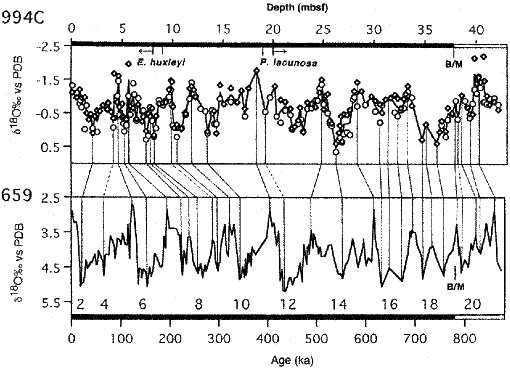
Figure 1.
Oxygen isotopic curve from Hole 994C and the tentative correlation with the
isotopic stratigraphy in Hole 659 (Tiedemann et al., 1994). The solid line of
Hole 994C is connected to the mean ![]() 18O
values of G. sacculifer (open circle) and G. ruber (open diamond), except in two
short intervals (17.56-20.36 mbsf and 34.72-36.43 mbsf) where only one type of
data were measurable because of the paucity of the taxa involved. The first
appearance of Emiliania huxleyi, last occurrence of Pseudoemiliania lacunosa,
and the Brunhes/Matuyama boundary (B/M) are also shown here. The numbers in the
lower part of the figure indicate oxygen isotopic stages. The dashed line
correlating between the records of Hole 994C and Hole 659 indicates less
reliable correlation.
18O
values of G. sacculifer (open circle) and G. ruber (open diamond), except in two
short intervals (17.56-20.36 mbsf and 34.72-36.43 mbsf) where only one type of
data were measurable because of the paucity of the taxa involved. The first
appearance of Emiliania huxleyi, last occurrence of Pseudoemiliania lacunosa,
and the Brunhes/Matuyama boundary (B/M) are also shown here. The numbers in the
lower part of the figure indicate oxygen isotopic stages. The dashed line
correlating between the records of Hole 994C and Hole 659 indicates less
reliable correlation.

![]()