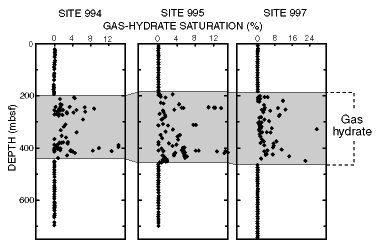
Figure 5. Plot of gas-hydrate saturations (percent of pore space occupied by gas hydrate) calculated from interstitial water chlorinities, assuming that the chloride anomalies at each site (Sites 994, 995, and 997) are solely produced by gas-hydrate decomposition during core recovery (modified from Paull, Matsumoto, Wallace, et al., 1996).

![]()