![]()
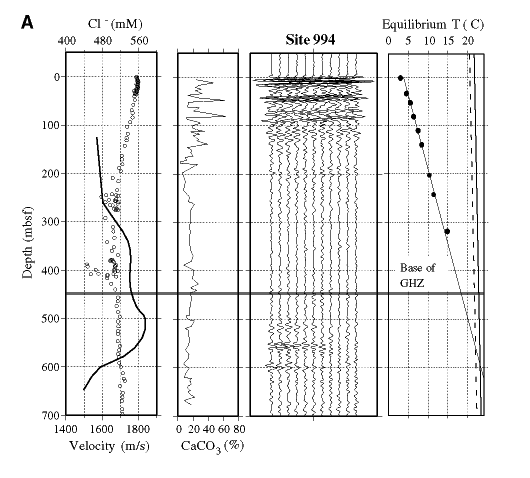
Figure 3. At each of Sites (A) 994, (B) 995, and (C) 997, a suite of geophysical measurements is compared with the Cl- and CaCO3 profiles. The minima in the Cl- profile (left, circles) are the most direct measure of hydrate concentration available and show roughly the same pattern of variation throughout the GHSZ (200-450 mbsf) at all three sites. At each site note the strong correlation between the peaks in CaCO3 (center left) and high seismic reflectivity (center right) in the upper ~100 m of the sediment column. Note also low Vp (bold curve, left panel) associated with the high seismic reflectivity lower in the section, between 450 and 600 mbsf. These effects accentuate the appearance of weak reflectivity from 100 to 450 mbsf. The intersection of the extrapolated temperature profile (right panel) with the phase equilibrium curve for 3.3% seawater (dashed curve) and fresh water (solid curve) at Sites 995 and 997 lies significantly deeper than the base of gas hydrate stability inferred from the seismic data, (redrawn from Paull, Matsumoto, Wallace, et al., 1996; Holbrook et al. 1996; and Ruppel, 1997).

![]()