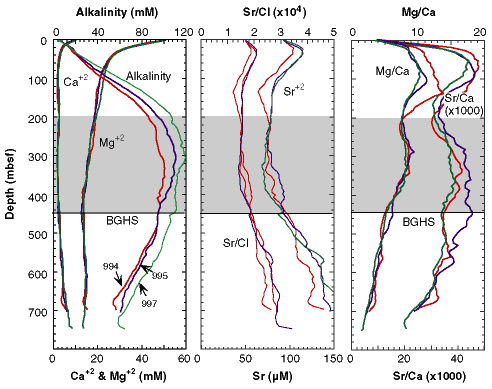
Figure 2. Variations of selected pore-water chemical constituents (Ca2+, Mg2+, and Sr2+ concentrations; total alkalinity; and Sr/Cl, Sr/Ca, and Mg/Ca ratios) vs. depth from Sites 994, 995, and 997 are shown (Paull, Matsumoto, Wallace, et al., 1996). Shaded area denotes region of sediment column where gas hydrates detected. BGHS represents the base of gas hydrate stability.

![]()