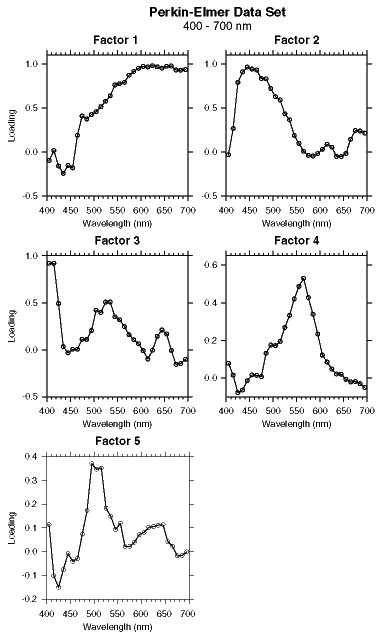
Figure 11. Factor-pattern curves from analyzing the shore-based Perkin-Elmer data set. This data set contains 1190 samples. The data were limited to 400-700 nm so that the extracted factors could be compared to similar data generated by the Minolta CM-2002 (Fig. 7), which is limited to this wavelength range.

![]()