![]()
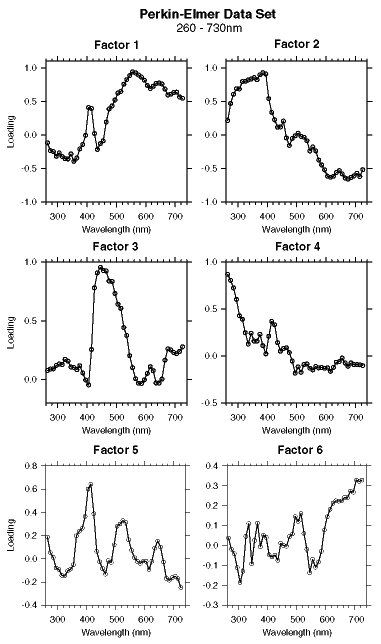
Figure 12. Factor-pattern curves from analyzing the shore-based Perkin-Elmer data set. This data set contains 1190 samples. Initially, the entire wavelength range of the Perkin-Elmer spectrophotometer was used, and wavelengths with low communalities deleted from the analysis. This resulted in a data set of first-derivative values from 260-730 nm. Although more factors were extracted, they were more difficult to interpret.
![]()