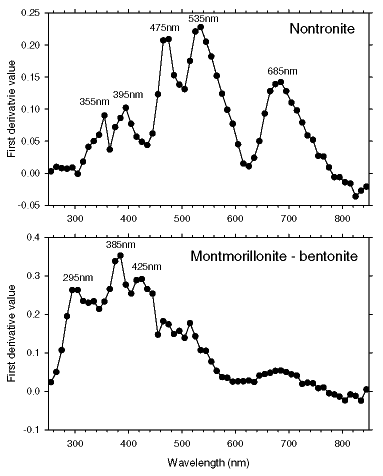
Figure 14. First-derivative curves for two samples of montmorillonite. The top curve is for Fe-rich montmorillonite or nontronite. This sample is Clay Mineral Repository sample NG-1 from Hohen Hagen, Germany and is described as nontronite sand with quartz. The lower curve is for API#25 from Upton, WY, which is described as a bentonite. Both samples were analyzed without the addition of other material. The analytical wavelength range for the Minolta Spectrophotometer is 400-700 nm and, for the Perkin-Elmer Lambda 6 spectrophotometer, 250-850 nm.

![]()