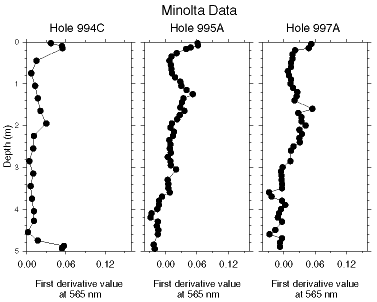
Figure 5. Variations in the first-derivative value at 565 m (Minolta data set) as a proxy for hematite content in the top 5 m of selected holes. Even though the sampling is denser with the shipboard Minolta data set, the high hematite still occurs at about the same depth as in the Perkin-Elmer data set. Note that, compared to the Perkin-Elmer data shown in Figure 4, the spectral values are muted.

![]()