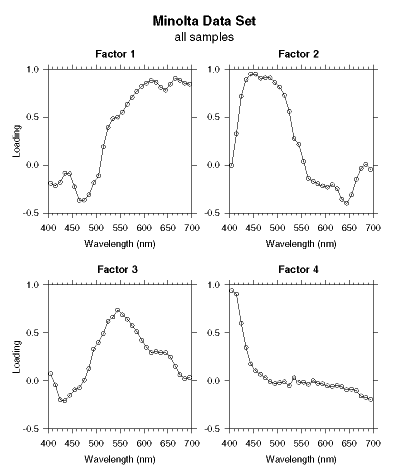
Figure 6. Factor-pattern curves (describing how important each wavelength is in each factor) derived from analyzing the full Minolta spectral data set. This data set contains 6766 samples and, for each sample, there are 30 first-derivative values calculated at the midpoint of the 10-nm sample interval from 400-700 nm. A varimax rotation was used before factor extraction and factors are listed in order of decreasing variance explained.

![]()