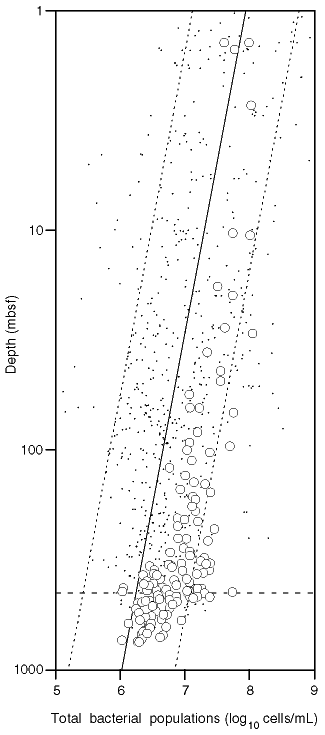
Figure 5. Bacterial populations in all deep marine sediments analyzed to date (small dots) with populations from Sites 994, 995, and 997 overlaid (open circles). The slanting solid line represents the general trend in all sediments (log10 bacterial numbers = 7.95-0.64 log10 depth [m]), and the dashed lines indicate the upper and lower 95% prediction limits. The approximate position of the BSR is represented by the horizontal dashed line.

![]()