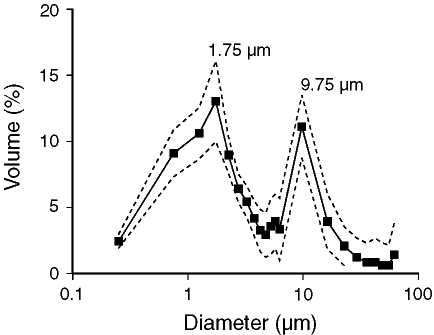
Figure 5. Mean particle-size distribution for the 54 samples (symbols) ±1 standard deviation (broken lines). The population of smaller particles is believed to consist primarily of clay minerals, whereas carbonate particles contribute to the population of larger particles.

![]()