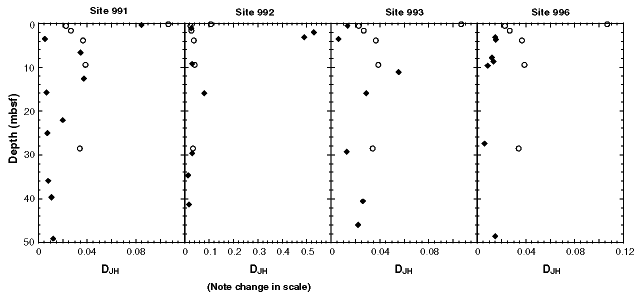
Figure 6. DJH plotted against sub-bottom depth at Site 991, Site 992, Site 993, and Site 996. Results from each of the diapir sites (solid symbols) are compared with results from Site 995 (open symbols). Note the change in DJH scale for Site 992, resulting from very high DJH values in Unit I at this site.

![]()