![]()
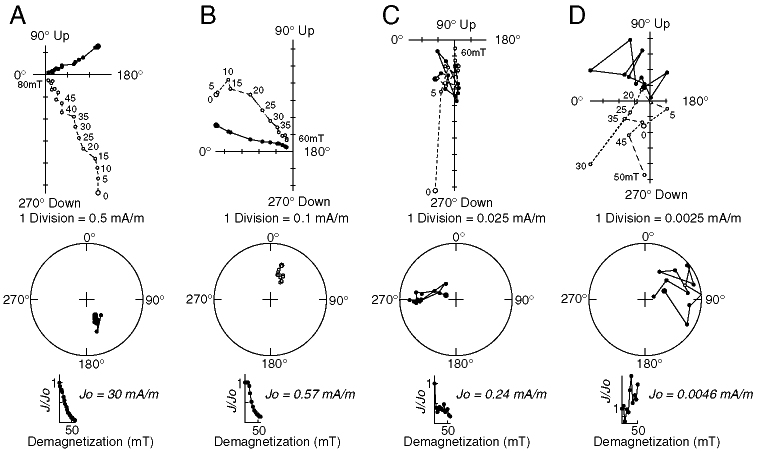
Figure 1. Representative Zijderveld, stereo, and intensity demagnetization plots for (A) Sample 164-994C-1H-2, 79-81 cm (2.29-2.31 mbsf), (B) Sample 164-994C-8H-3, 19-21 cm (64.59-64.61 mbsf), (C) Sample 164-994C-2H-2, 59-61 cm (6.49-6.51 mbsf), and (D) Sample 164-994C-3H-1, 79-81 cm (14.69-14.71 mbsf). Based on the type of response to progressive AF demagnetization, samples were classified into one of three types: X (samples A and B), Y (sample C), and Z (sample D). Samples of Types X and Y were usable for magnetostratigraphic purposes. Zijderveld plot: solid circles = projection on the horizontal plane, open circles = projection on the vertical plane. Stereo plot: solid circles = the lower hemisphere. Declination is with respect to core coordinates.
![]()