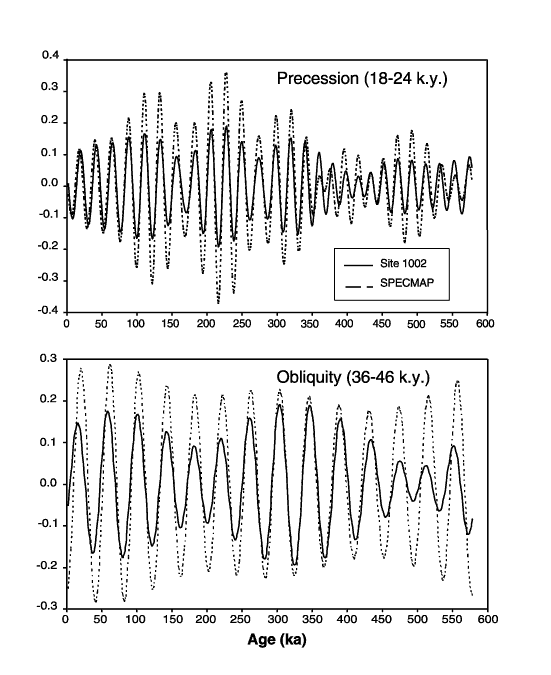
Figure 7.
Comparison of filtered components of the Site 1002 and SPECMAP  18O records corresponding to the frequencies of precession (top; filter centered at 21 k.y.) and obliquity (bottom; filter centered at 41 k.y.). All curves have been transformed to have zero means with arbitrary scales. Inspection of the filtered data show that the isotopic signals of Site 1002 are well matched to the SPECMAP
  18O chronology in both frequency bands.
![]()