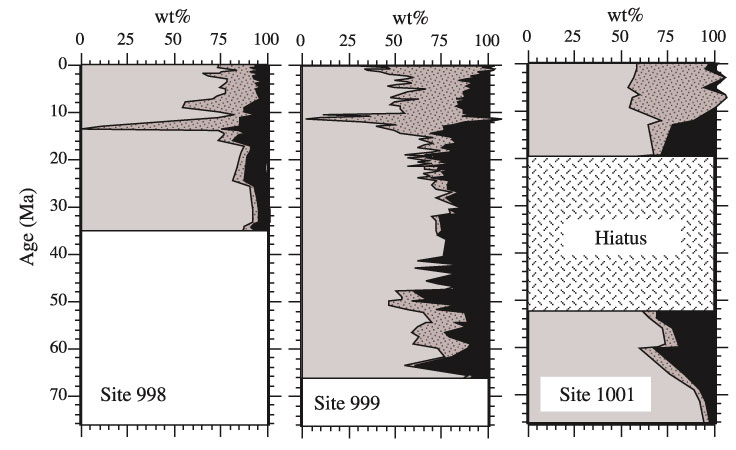
Figure 2. Absolute concentrations (in weight percent) of CaCO3 (light gray), terrigenous matter (dark gray with spots), and dispersed ash (black) at Sites 998, 999, and 1001 plotted vs. age (Ma). Note hiatus at Site 1001.