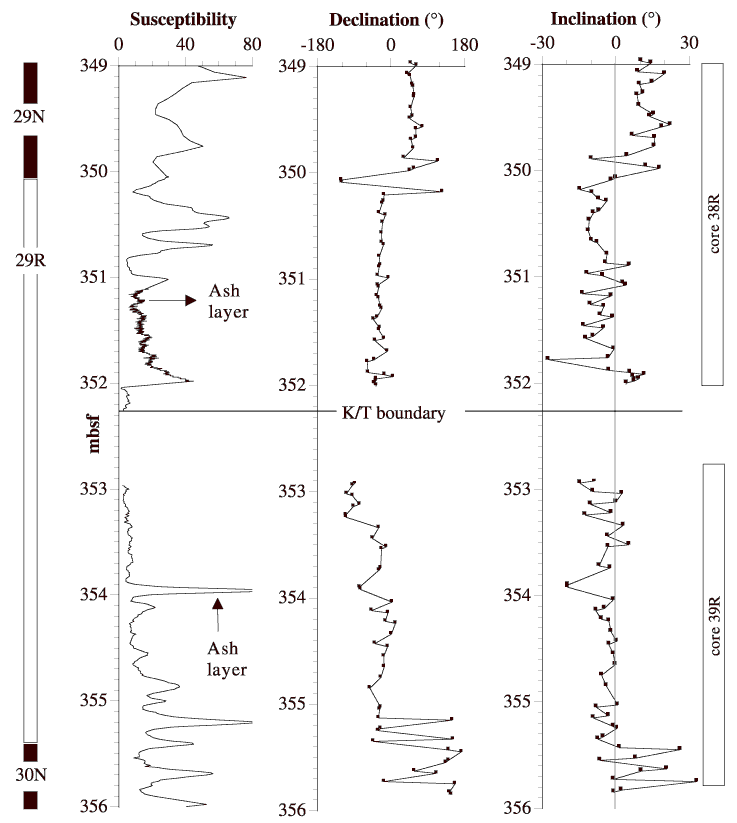
Figure 3. Magnetic stratigraphy of the K/T boundary interval of Hole 1001A. Data are AF demagnetized between 40.0 and 80.0 mT. Polarity time scale interpretation is shown in the left column. The susceptibility data is whole core data in SI units, whereas the directional data is from subsamples.

![]()