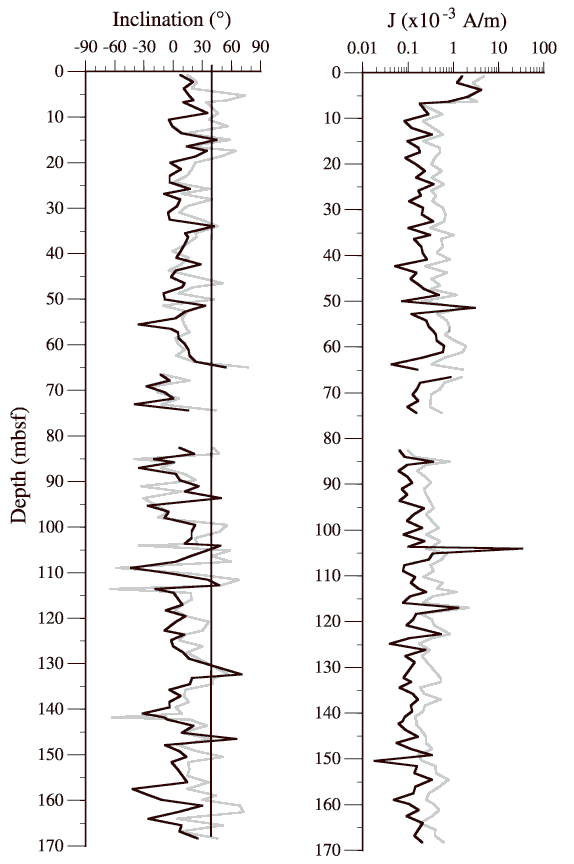
Figure 4. Inclination and magnetization data from Hole 1002C. The gray curve represents NRM data, and the black curve is the NRM data after AF demagnetization at 15.0 mT. The vertical line on the inclination curve is the expected axial dipole inclination for the site latitude.

![]()