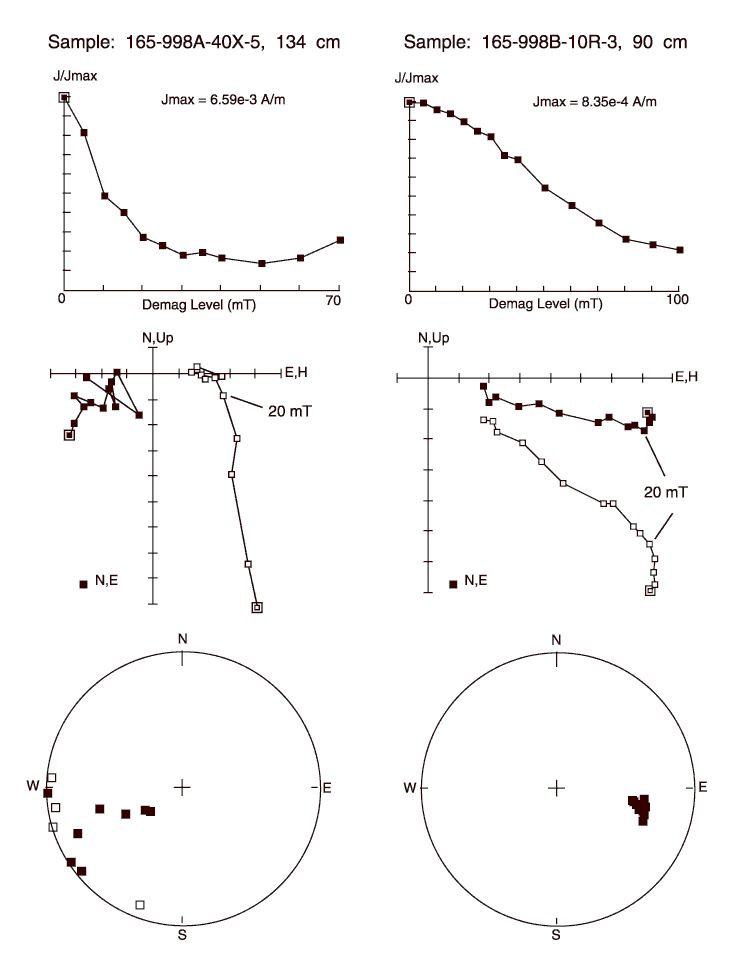
Figure 2. AF demagnetization results for Samples 165-998A-40X-5, 134 cm, and 165-998B-10R-3, 90 cm. Top diagrams show the intensity variation with progressive demagnetization; the middle diagrams show vector end points on a vector demagnetization diagram (orthogonal projections where open squares are inclination and solid squares are declination); and the bottom diagrams show the magnetization directions on equal-area stereonets (open squares are directions with negative inclinations). As is typical for many samples from Site 998, these samples have a steep drill-string overprint. Demagnetization removes the overprint, but often all that remains is a poorly defined ChRM, as is the case for Sample 165-998A-40X-5, 134 cm. Less often, stable ChRM directions can be defined as shown for Sample 165-998B-10R-3, 90 cm. J/Jmax = intensity (J) normalized by the maximum intensity (Jmax) measured during demagnetization.

![]()