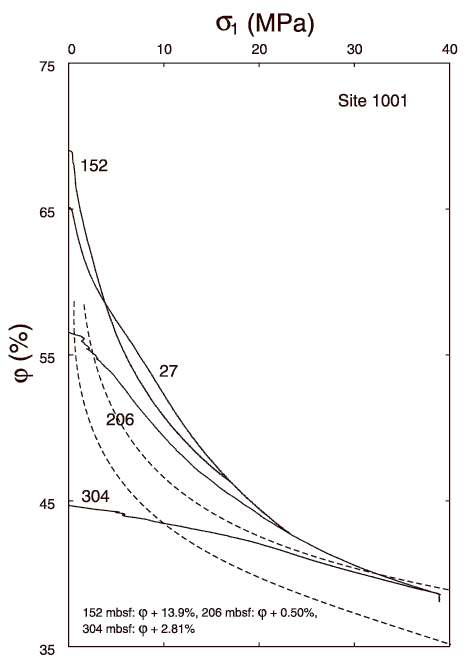
Figure 9.
Compaction curves showing uniaxial stress ( 1) vs. porosity (
 ) for samples from Site 1001. Sample depths are labeled in meters below seafloor. The curves for the deeper samples (152, 206, and 304 mbsf) have been shifted along the porosity axis to meet the curve defined by the shallowest sample (27 mbsf). The dashed reference curves are matrix compaction curves for Site 807 (Lind, 1993a).

![]()