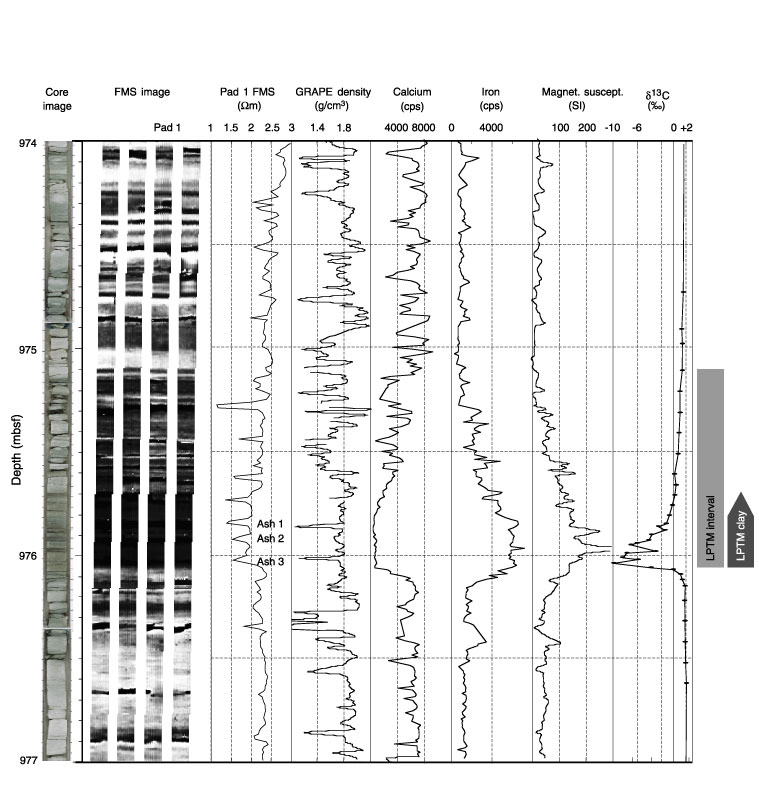
Figure 5. The upper Paleocene interval drilled in Hole 999B. The section from 974 to 977 mbsf (logging depth) is shown next to the core image. The carbon isotope curve (from Bralower et al., 1997) identifies the LPTM by its typical negative carbon isotope excursion. All core logging data from the MSCL and XRF core scanner are collected in 1 cm steps.
![]()