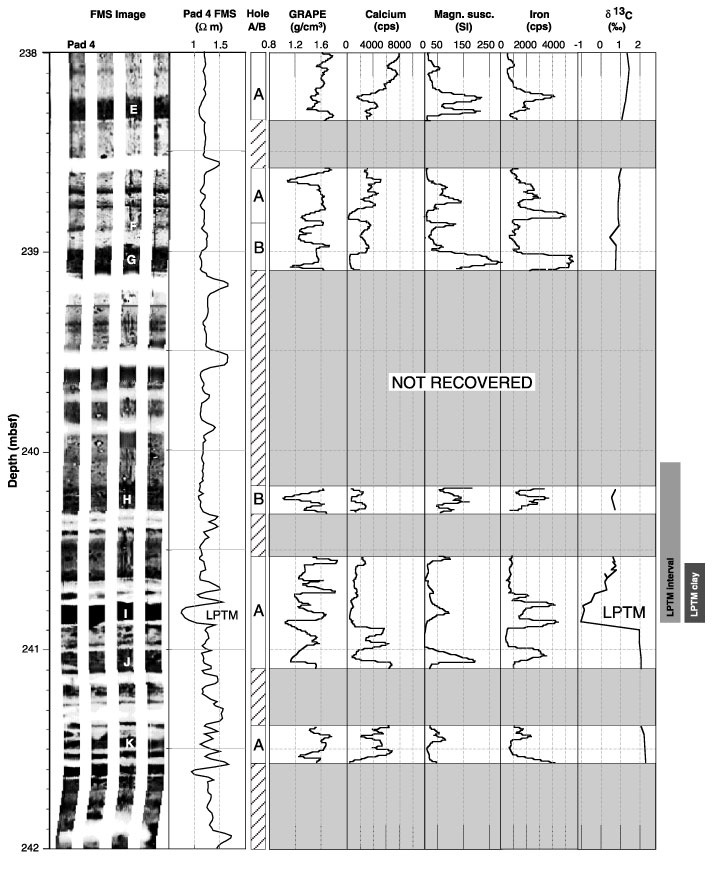
Figure 6. The composite upper Paleocene interval recovered at Site 1001 as a result of detailed correlation between the core data of the two adjacent holes 1001A and 1001B and comparison with continuous downhole FMS data. The section from 238 to 242 mbsf (logging depth) is shown. In the FMS image the white letters indicate volcanic ash layers used for correlation (modified from Bralower et al. [1997]). The carbon isotope curve (from Bralower et al. [1997]) identifies the LPTM by its typical negative carbon isotope excursion. All core logging data from the MSCL and XRF core scanner are collected in 1 cm steps.
![]()