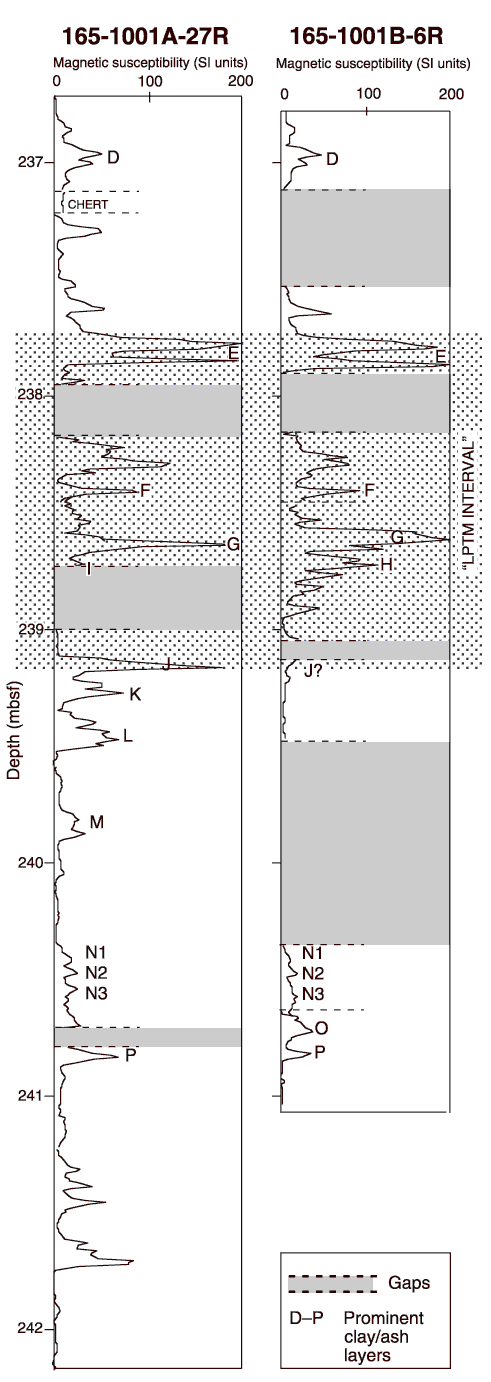
Figure 9. The Paleocene/Eocene boundary as observed in Cores 165-1001A-27R and 165-1001B-6R. The correlation of the two cores are shown: the core section data are partly cut into single pieces to allow better fit of the correlation and construction of a complete section. Magnetic susceptibility data are collected at 1 cm intervals with the MSCL.

![]()