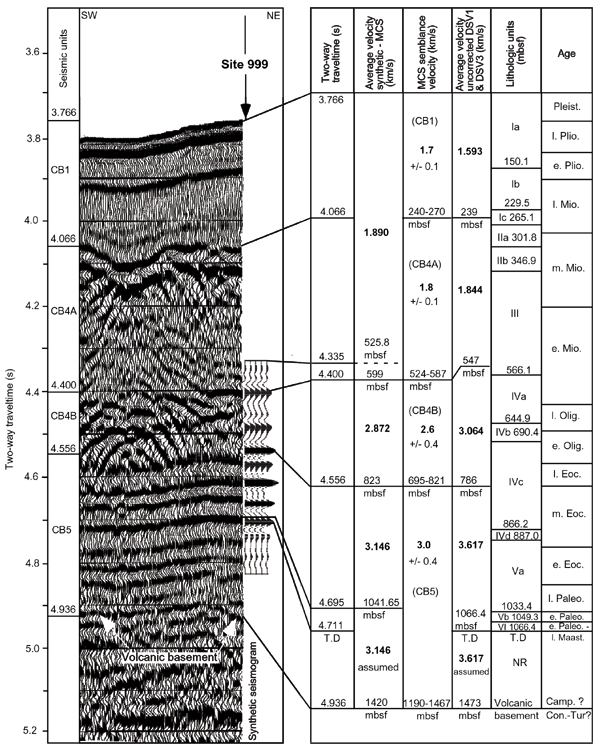
Figure 2. An ~4-km portion of IG2901 MCS Line CT1-12a is displayed with a vertical exaggeration of 15x. Site 999 location marked on this profile is 800 m west of actual site location determined by Global Positioning System. Correlations with the reflection seismic record were constrained by comparison to synthetic seismograms calculated using downhole sonic velocity (DSV) and density data and the far-field source wavelet represented by the seafloor reflection. Two-way traveltimes listed are measured from the MCS record at the Site 999 location and correspond to seismic unit boundaries and the start and end depths of the sonic velocity log. Average velocities and resulting depths shown are derived from three independent data sets: (1) MCS synthetic correlation, (2) average of 50 MCS velocity analyses (Bowland, 1993), and (3) two-way traveltime vs. depth derived from uncorrected compressional velocities measured by P-wave logger and Hamilton Frame laboratory instruments. A range of volcanic basement depths are estimated by extending the average velocity derived from physical properties and synthetic seismogram measured within seismic Unit CB5 to 4.936 s TWT and by using velocities from MCS velocity analyses. Ages and lithologic units are from Shipboard Scientific Party (1997; Site 999).

![]()