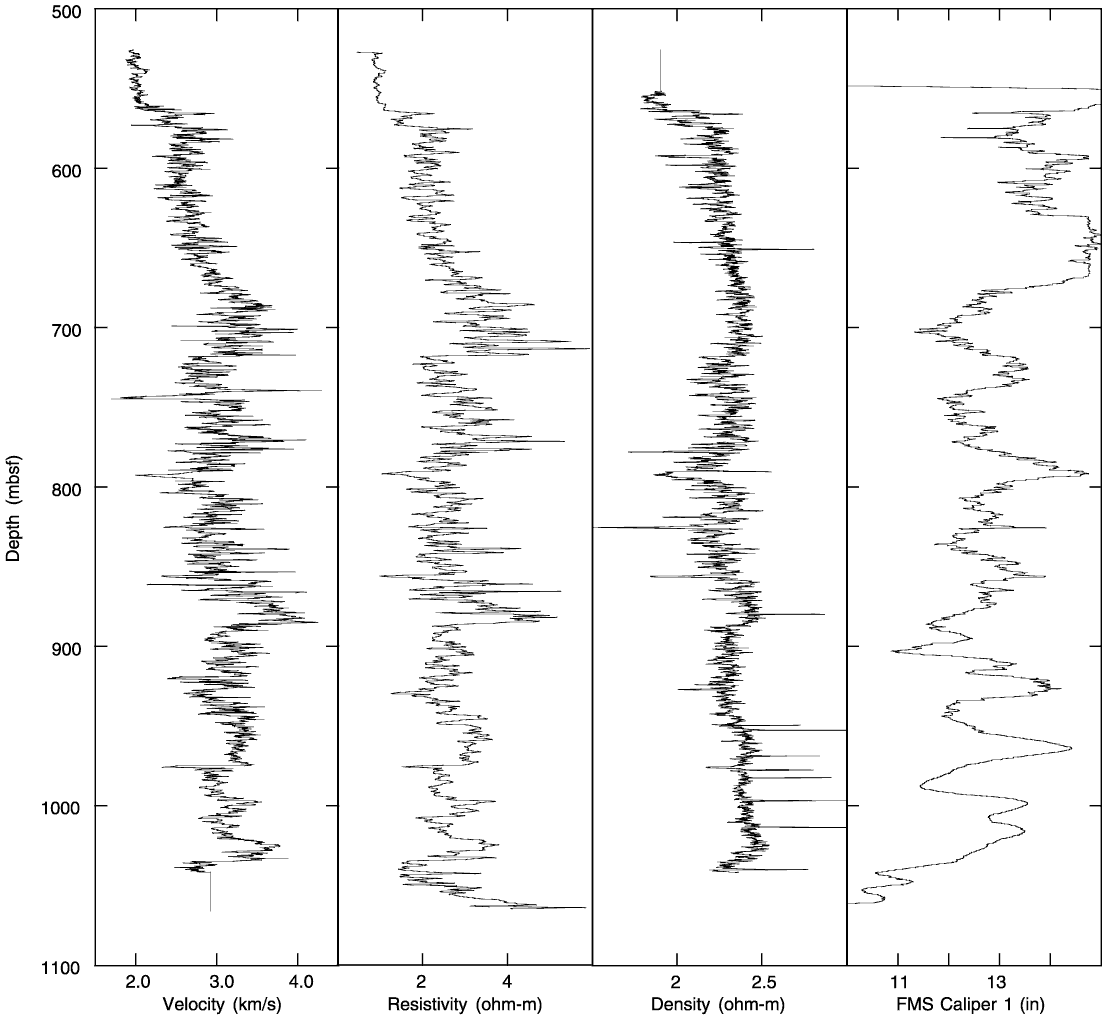
Figure 4. Velocity, density, and resistivity (medium induction resistivity tool) along with caliper 1 from the Formation MicroScanner tool are displayed through the entire logged section of Hole 999B. The closely co-varying velocity, density, and resistivity curves indicate that the variable diameter of the borehole did not adversely effect the data.

![]()