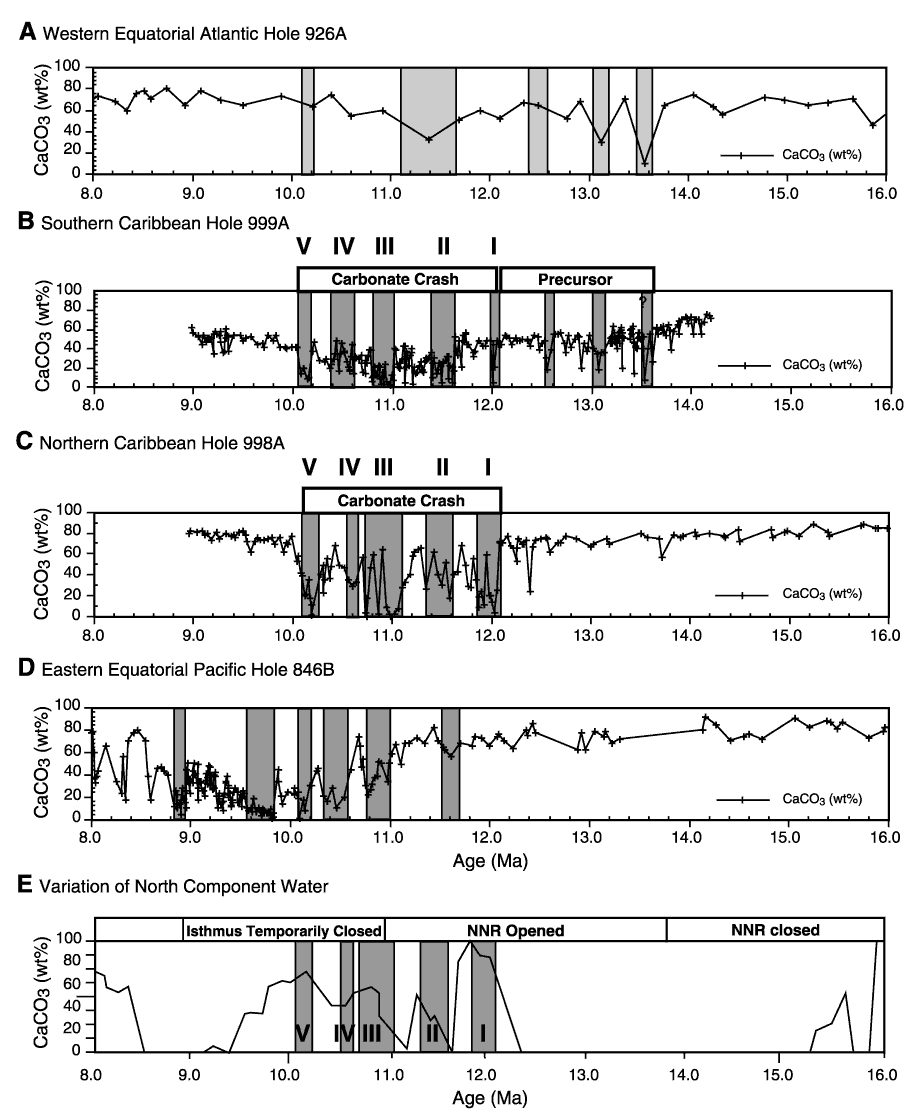
Figure 15. Variations of carbonate-content values between 16 and 8 Ma in three different areas of the globe. A. Hole 926A from the Ceara Rise in the equatorial Atlantic, Leg 154 (Curry, Shackleton, Richter, et al., 1995). B. Hole 999A in the Colombian Basin (see Fig. 9). C. Hole 998A in the Yucatan Basin (see Fig. 9). D. Hole 846A from the eastern equatorial Pacific, Leg 138 (Pisias, Mayer, Janecek, Palmer-Julson, van Andel, et al., 1995). E. Variations of North Component Water production in the North Atlantic from Wright and Miller (1996). NNR = northern Nicaraguan Rise. Stippled columns in B, C, D, and E correspond to intervals of reduced carbonate values that include the five episodes of carbonate dissolution (I-V) observed during the Caribbean carbonate crash (see Figs. 11, 12). The timing of these episodes corresponds surprisingly well with the peaks of North Component Water production in the North Atlantic. Columns with lighter shading in A represent dissolution inferred through reduced coarse fraction in Hole 926A (Shackleton and Crowhurst, 1997). In B, three of these intervals are synchronous with three episodes of carbonate dissolution in Hole 999A that occurred during the carbonate crash precursor. The initial carbonate decrease in Hole 846B in the eastern equatorial Pacific (shown in D) at ~11 Ma corresponds to the Caribbean dissolution Episode III (shown in B and C). Episodes IV and V in B and C correspond to intervals of low carbonate values in Hole 846B. Note that the interval characterized by the lowest carbonate values between 9.8 and 9.5 Ma in Hole 846B, the nadir of the carbonate crash in the eastern equatorial Pacific, occurred at a time when the carbonate system had already recovered in the Caribbean basins.

![]()