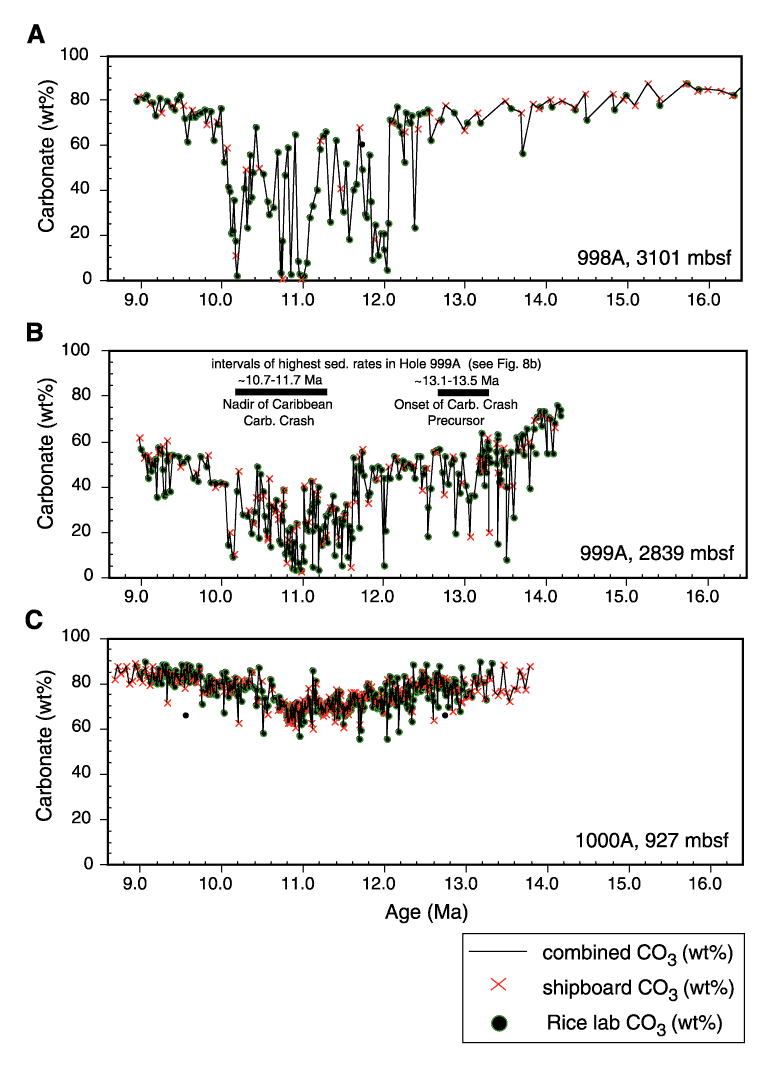
Figure 9. Comparison of two carbonate-content data sets derived from Leg 165 shipboard analyses and postcruise Rice University analyses. A. Hole 998A. B. Hole 999A. C. Hole 1000A. Note that the carbonate 0-100 wt% range of the vertical axes is at the same scale for the three plots.

![]()