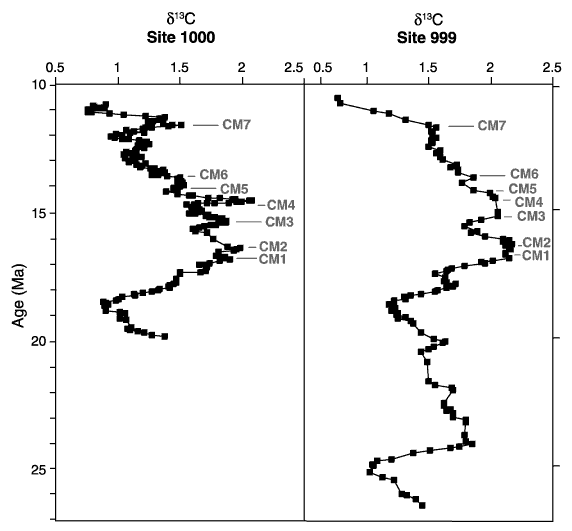
Figure 10. Carbon-isotope data for Sites 1000 and 999 plotted against age. The chronologies at both sites remain based on biostratigraphy. The short horizontal gray lines indicate the Miocene 13C maxima (CM) from Woodruff and Savin (1991).