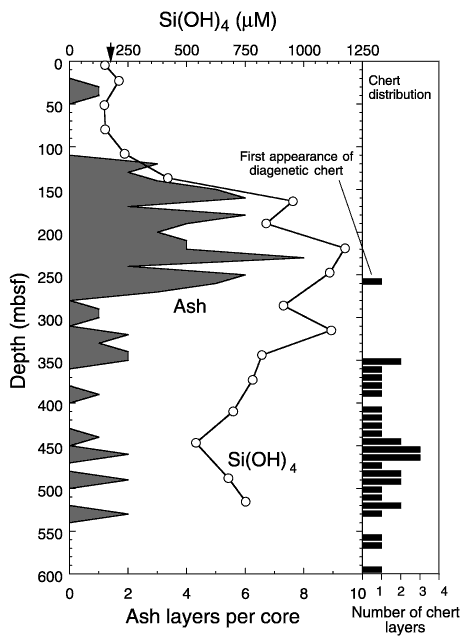
Figure 13. Depth profile for silica in Site 998 interstitial waters. Frequency of chert layers with depth are indicated in the histogram. Distribution of discrete ash layers (shaded area) is also included. The arrow indicates mean ocean bottom-water silica concentration.

![]()