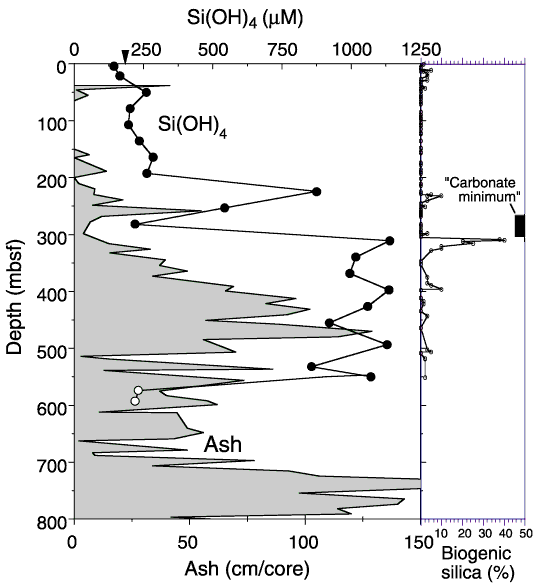
Figure 16. Depth profile for silica in Site 999 interstitial waters. Distribution of discrete ash layers (shaded area) is also included. Also plotted is the distribution of biogenic silica as determined by smear-slide analysis. The arrow indicates mean ocean bottom-water silica concentration. The two symbols (open and solid) used in the silica profile reflect the incorporation of data from two holes at Site 999.

![]()