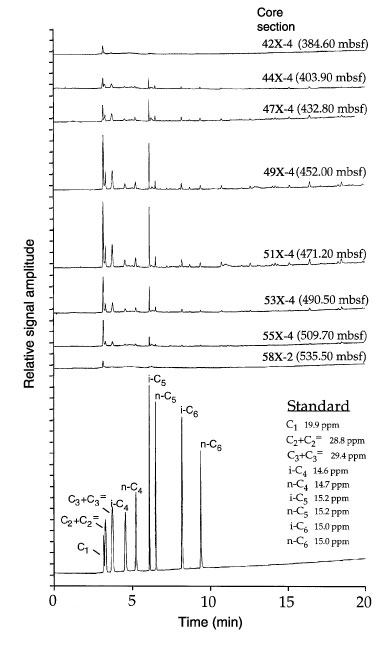
Figure 8. Chromatogram composite from the zone of volatile hydrocarbon enrichment at Site 1000 (see text and related figures). Data from overlying and underlying hydrocarbon-deficient zones are included for comparison. Concentrations can be estimated by comparing signal amplitudes (peak heights) of the sample intervals to those of the standard. Vertical scales are constant, and a linear correspondence between the unknowns and the standard can be assumed for a given hydrocarbon.
![]()